從 Prometheus 查詢指標
此任務說明如何使用 Prometheus 查詢 Istio 指標。在此任務中,您將使用基於 Web 的介面來查詢指標值。
本任務範例會使用 Bookinfo 範例應用程式。
開始之前
- 在您的叢集中安裝 Istio。
- 安裝 Prometheus 附加元件。
- 部署 Bookinfo 應用程式。
查詢 Istio 指標
驗證
prometheus服務是否在您的叢集中執行。在 Kubernetes 環境中,執行以下命令
$ kubectl -n istio-system get svc prometheus
NAME         TYPE        CLUSTER-IP       EXTERNAL-IP   PORT(S)    AGE
prometheus   ClusterIP   10.109.160.254   <none>        9090/TCP   4m
將流量發送到網格。
對於 Bookinfo 範例,請在您的網路瀏覽器中訪問
http://$GATEWAY_URL/productpage,或執行以下命令$ curl "http://$GATEWAY_URL/productpage"開啟 Prometheus UI。
在 Kubernetes 環境中,執行以下命令
$ istioctl dashboard prometheus點擊標題中 Prometheus 右側的 Graph。
執行 Prometheus 查詢。
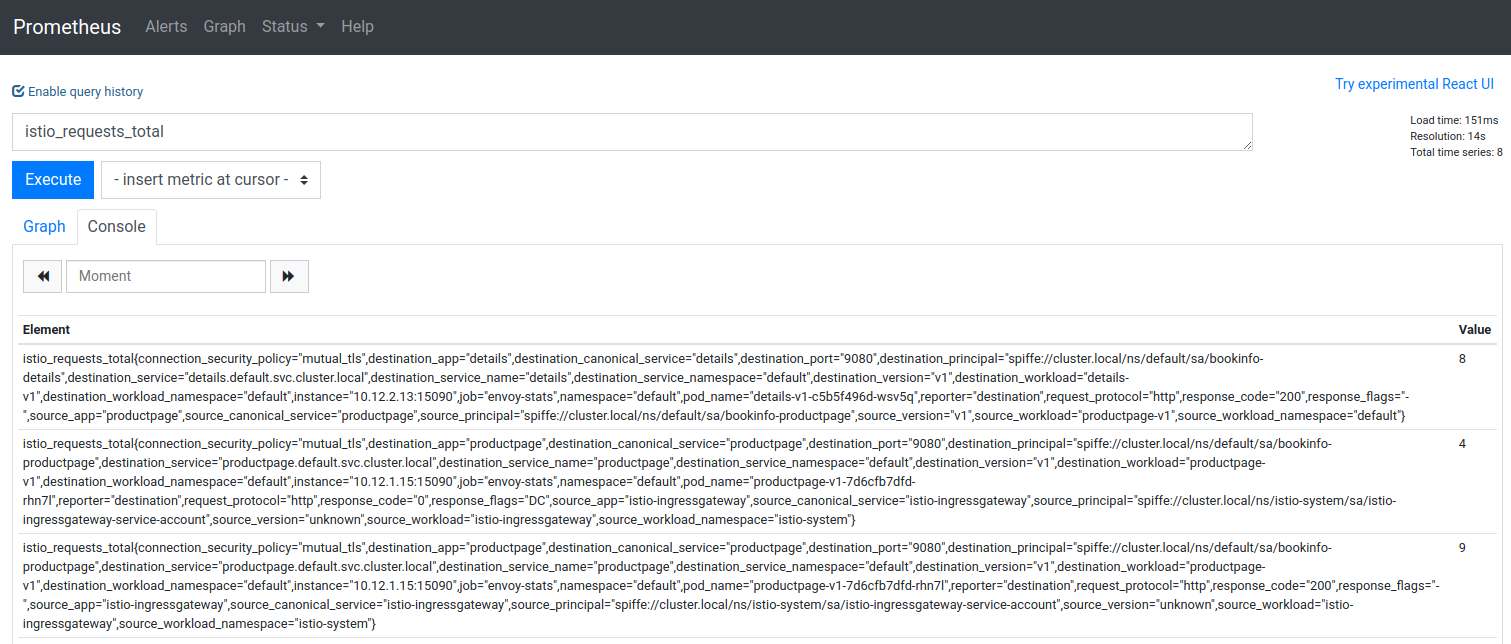
在網頁頂部的「Expression」輸入框中,輸入文字
istio_requests_total然後,點擊 Execute 按鈕。
結果將類似於
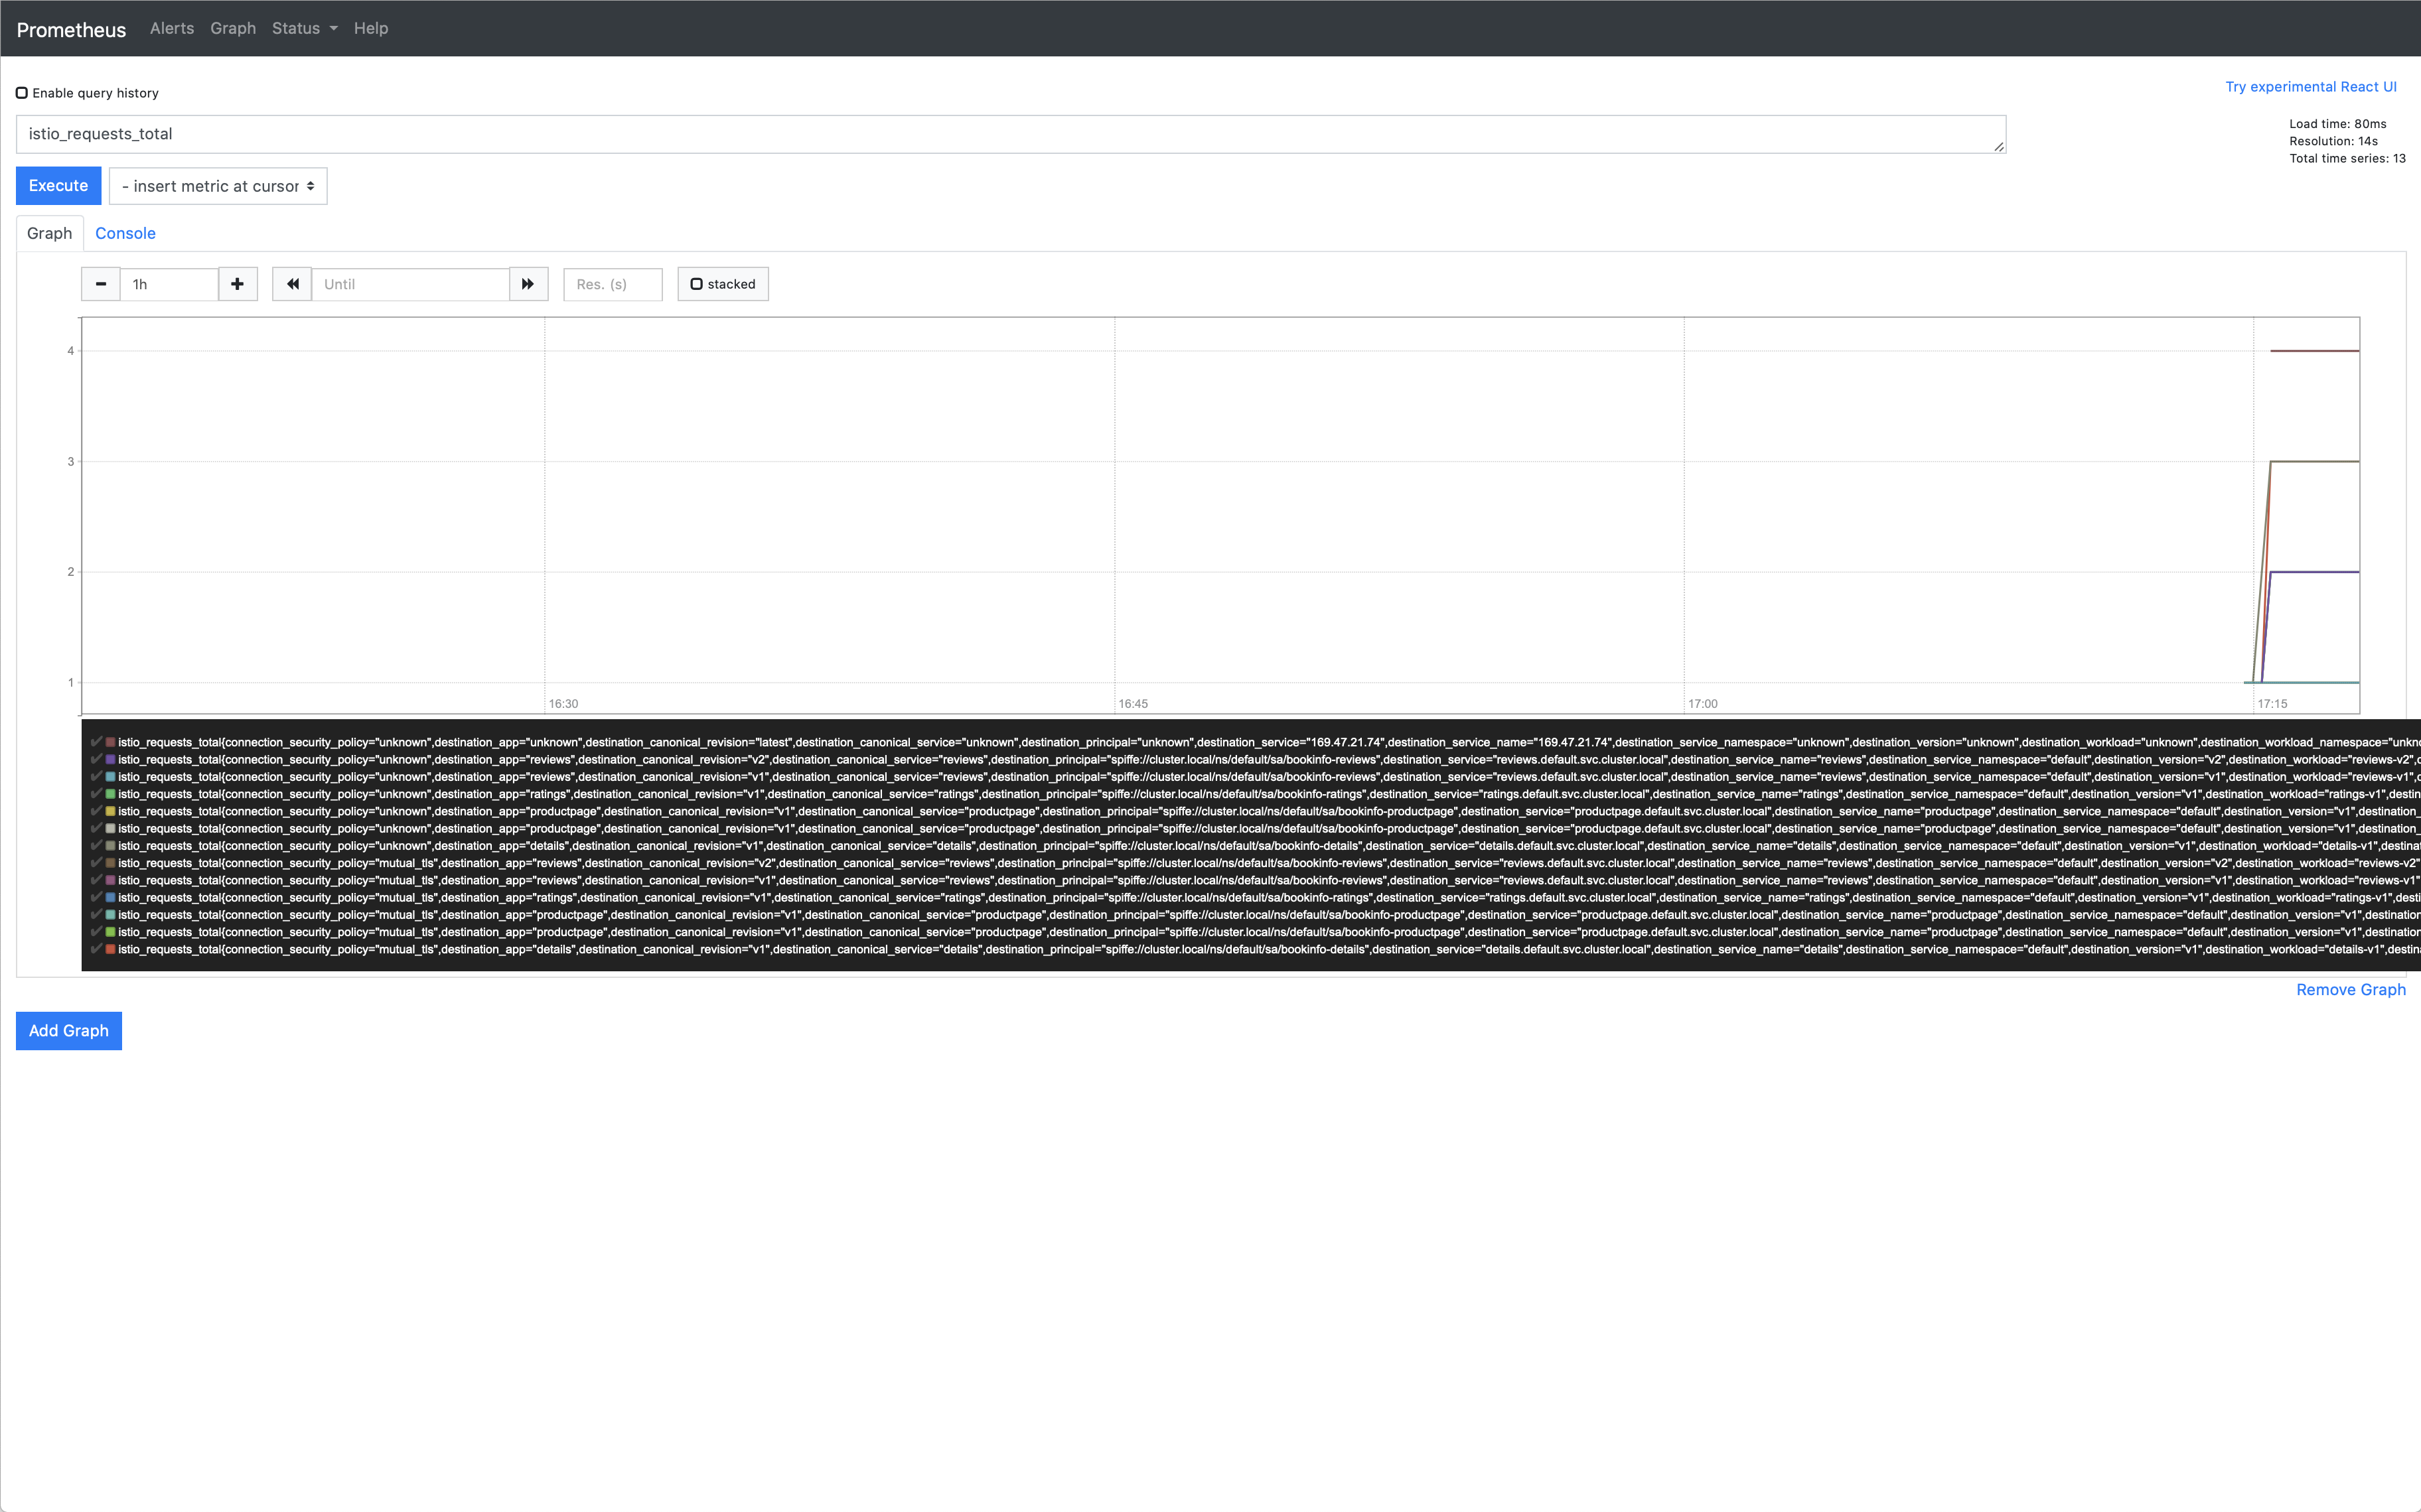
您也可以通過選擇 Execute 按鈕下方的 Graph 標籤,以圖形方式查看查詢結果。
其他可嘗試的查詢
到
productpage服務的所有請求總數istio_requests_total{destination_service="productpage.default.svc.cluster.local"}到
reviews服務v3版本的所有請求總數istio_requests_total{destination_service="reviews.default.svc.cluster.local", destination_version="v3"}此查詢返回目前到
reviews服務 v3 版本的所有請求總數。過去 5 分鐘內到
productpage服務的所有實例的請求速率rate(istio_requests_total{destination_service=~"productpage.*", response_code="200"}[5m])
關於 Prometheus 外掛程式
Prometheus 附加元件是一個 Prometheus 伺服器,它預先配置為抓取 Istio 端點以收集指標。它提供了一種機制來持久儲存和查詢 Istio 指標。
有關查詢 Prometheus 的更多資訊,請閱讀他們的 查詢文件。
清理
使用 Control-C 或以下命令移除任何可能仍在執行的
istioctl進程$ killall istioctl如果您不打算探索任何後續任務,請參閱 Bookinfo 清理 指示來關閉應用程式。